
With the onset of the Covid-19 pandemic a year ago, economic activities shut down around the world as lockdowns, quarantines, social distancing and other health measures were introduced. The pandemic itself, combined with the public health measures, created an unprecedented economic shock.
Bangladesh has not been immune, though considerable difference of opinion remains about both the magnitude of the economic slowdown last year as well as the pace and trajectory of any recovery since. The official government figures are the most optimistic, with economic growth expected to rebound to over 8% trajectory in the current financial year. But there are grounds to doubt even the pre-pandemic official growth estimates.
In addition to the alleged overestimation, a major problem with the official Gross Domestic Product (GDP) figures is that it is available only annually. That means, even if the official government growth estimates were taken at face value, we would not know until the end of the financial year whether the recovery has taken root.
Instead of relying solely on the official GDP statistics, the World Bank has started taking a broader approach. Using Google Mobility data, electricity generation, government tax revenue, readymade garments exports, and import of vehicles, the World Bank estimates that the economic activities in the financial year 2019/20 were growing at over 5% up to March 2020, but contracted in the year to June (in Bangladesh, financial years are from July 1st to June 31st.). Overall, a mere 2% growth is estimated to have been recorded in the 2019/20 financial year, slowing even further to 1.6% this year.
The series of charts presented here follows an approach that is similar to the World Bank approach. Trends in these indicators are analysed: electricity generation; industrial production; exports; imports; credit to private sector; tax revenue; development and non-development expenditure; remittances; workers going overseas; wages; inflation; rice prices; residential rents; interest rates; credit to public sector; foreign reserves; and, stock prices.
This list includes all the indicators used by the World Bank, except for Google Mobility data.
Some of these indicators contribute to GDP, while others are correlated with GDP. Then there are measures that, while not directly linked with growth, can still point to the health of the economy or lack thereof. All these indicators are presented as a set of charts on a quarterly basis. Each chart is accompanied by a brief note, and an overall assessment is offered.
In addition to tracking the economy in real time, the charts will provide a clearer means by which to more accurately assess Bangladesh’s growing economy, using data that is less easy to manipulate for political ends.
These charts will be updated on a quarterly basis on the Netra News website.
There is one major caveat. It should be noted that the indicators only represent the urban, formal economy, and not the rural, agricultural, and the informal sectors. For all the development of the past 50 years, Bangladesh is still a poor country with a large rural economy as well as a major informal sector. While it is hard to see the informal sector thriving when the formal economy is sluggish, the lack of any explicit indicator of the agriculture sector presents an important caveat to the analysis presented.
All data are from the CEIC Asia Database. Raw data have been smoothed as indicated. The latest available data point in each series is shown in the charts.
Chart 1: Electricity generation
Growth in electricity generation is an oft-used correlate of economic activities. Of course, at any point in time this indicator can grow at a different pace than the overall GDP, for example it will grow faster when new electricity capacity comes on line. Prior to Covid-19, electricity generation was growing by 9-11% a year. Growth in this indicator started plummeting in April 2020, and barely grew in the year to November 2020.

Chart 2: Industrial production
Growth in industrial production directly contributes to economic growth. Industrial production in medium and large manufacturing (which covers the readymade garments sector) was already slowing well before the pandemic, with growth in the series declining from a yearly pace of over 15% in the year to the mid-2019 to less than 9% before the pandemic. This indicator was barely growing in the year to November 2020.

Chart 3: Exports
Exports are, of course, a component of GDP. Like industrial production, exports growth started slowing well before the pandemic, with growth declining from 10% or so in the year to the mid-2019 to around 3% before the pandemic. Unsurprisingly, exports tanked last year during the height of the global lockdown last year. By December 2020, exports stopped declining on a year-ended basis.

Chart 4: Imports
Mechanically, imports detract from GDP growth — though imported goods and services are either consumed or used for production, and thus indirectly contribute to economic growth. Too fast a growth in imports means the economy is on an unsustainable trajectory. But if import growth is too sluggish then it implies weakness in domestic consumption and investment. Imports were already declining on a year-ended basis in the second half of 2019, consistent with the pre-Covid economic weakness in other indicators. While not as bad as the mid-year, imports were still declining at a hefty clip in the year ending December 2020.
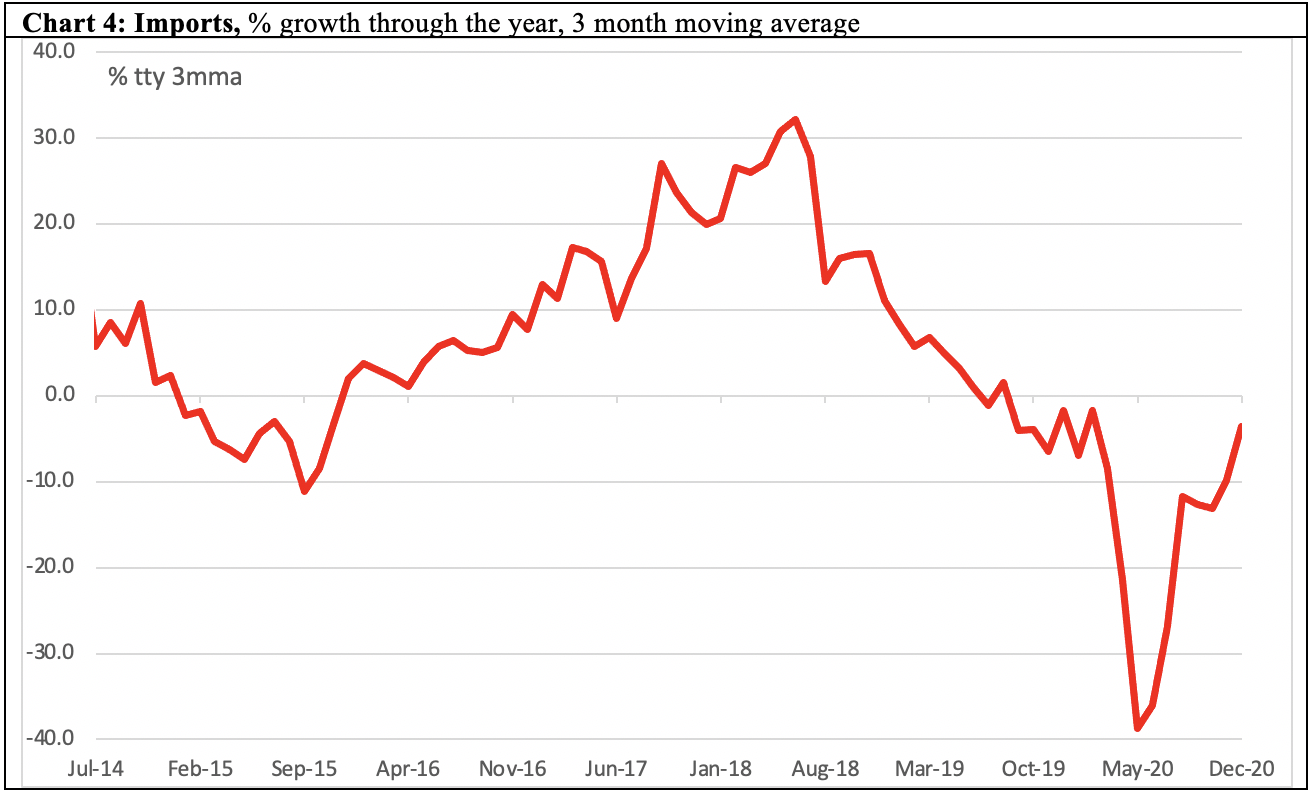
Chart 5: Credit to private sector
Credit to the private sector is a leading indicator of investment by firms and businesses. While too fast a pace of growth in this indicator might signify unsustainable exuberance in the corporate sector, a sustained slowdown signifies a poor investment outcome. In year-ended terms, credit to the private sector started slowing in early 2018, with no sign of bottoming out as of January 2021.

Chart 6: Tax Revenue
Governments typically tax household consumption and household and corporate incomes, all of which contribute to economic growth. Tax revenue growth slowed in the second half of 2019, and then collapsed during the lockdown. It was still declining year-ended January 2021.

Charts 7 and 8: Development expenditure and non-development expenditure
Both development expenditure and non-development expenditure contribute to economic growth. Both collapsed during the lockdown, and neither appeared to have bottomed out in the year ended November 2020.


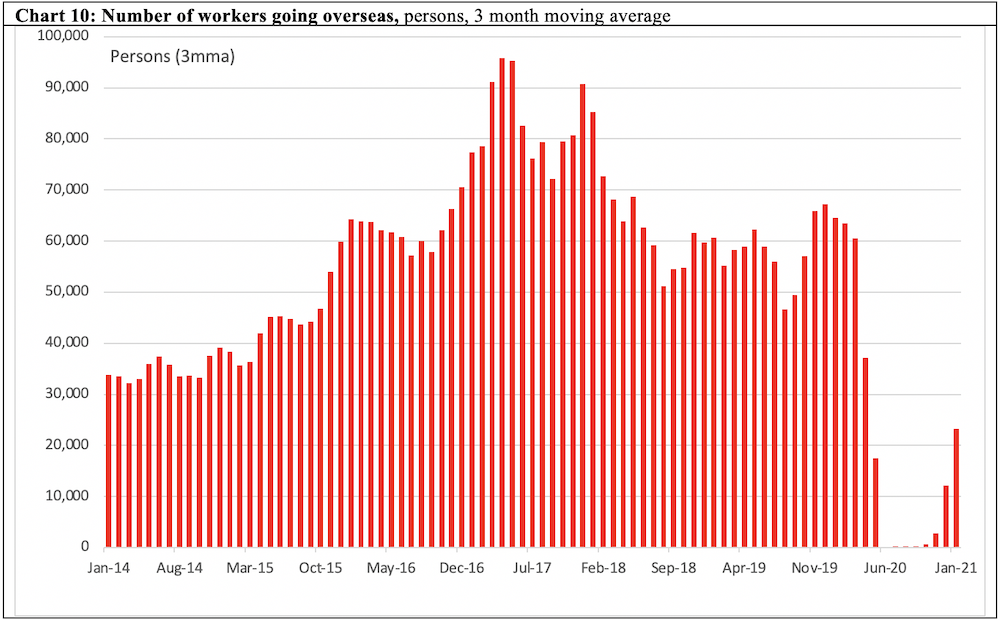
Charts 9 and 10: Remittances and overseas workers
While not directly measured in GDP figures, remittances from overseas workers are an important driver of economic growth in Bangladesh. Remittances initially collapsed as the pandemic hit, but then rebounded strongly in the second half of the year. It is important to note that this is the formal measure of remittance. The parallel, informal channel of remittance (the so-called hundi system) almost certainly ground to a halt with travel bans around the world, leaving the formal channel as the only source of remittance. Number of workers going overseas ground to a halt in mid-2020, but a trickle appears to have started by January 2021.

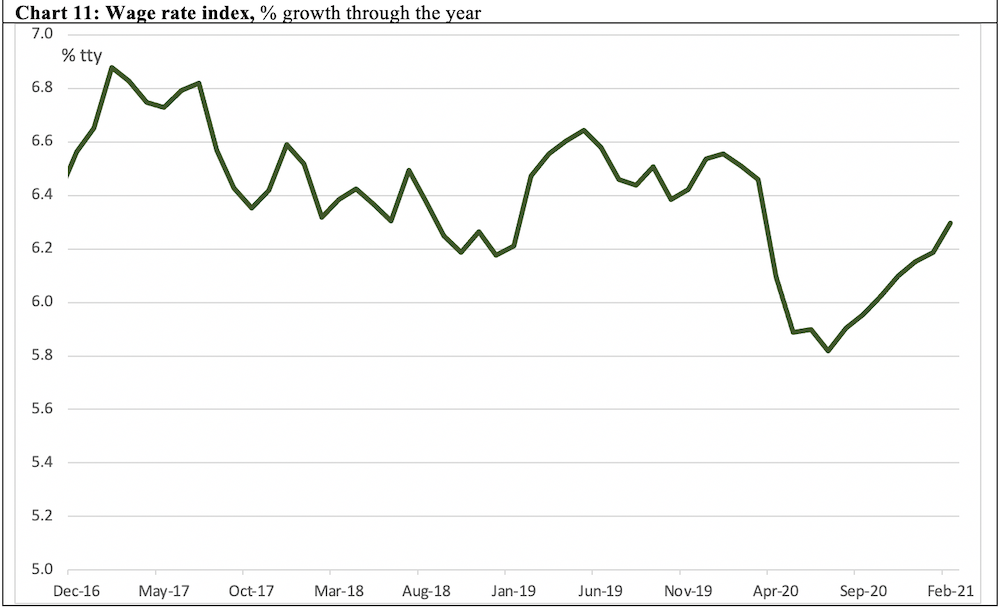
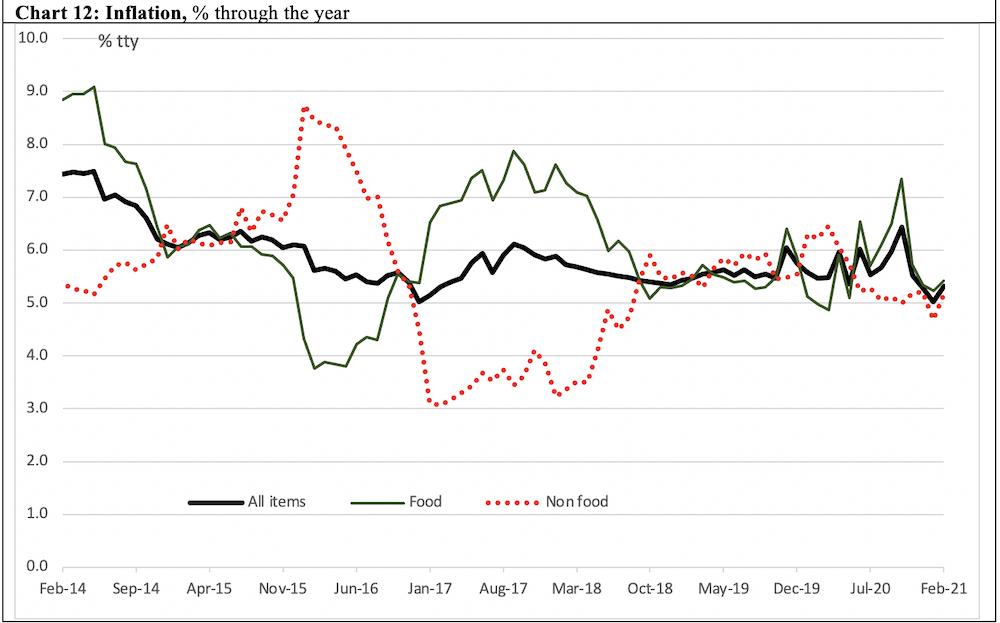
Charts 11 and 12: Wage rate index and inflation
Growth in the wage rate index usually depends on economic growth and inflation. Wages growth slowed sharply between March and June 2020, but have steadily picked up again. Inflation has been moderate till the year ended February 2021, except for a food price spike around October 2020.
Charts 13 and 14: Price of rice and rental prices in Dhaka
Price of coarse rice in Dhaka corroborates the food price inflation, rising since the beginning of the lockdown until August 2020, possibly reflecting the effect of the lockdowns on the supply chain. The rental price index in Dhaka on the other hand, showed a slowdown last year to September 2020, consistent with the general economic malaise.


Charts 15, 16, 17: Interest rates, credit to public sector and foreign reserves
In addition to the above indicators, government policy settings and actions also affect the economy. Since the beginning of the pandemic, Bangladesh Bank has cut official interest rates, and both deposit and borrowing rates have tumbled as of February 2021. In theory, this should support economic activities. On the other hand, when credit to the public sector grows too fast, private borrowing and investment is crowded out. Public sector borrowing spiked at the onset of the pandemic, but appears to have eased since then, still slowing in the year ended January 2021. Finally, Bangladesh Bank’s stock of foreign reserves is an important buffer against external shocks. Typically, reserves worth three months of imports are considered adequate. As of December 2020, stock of reserves (expressed in months of imports) partly reflecting the collapse in imports shown above.


Chart 18: Stock market
Finally, the stock market is an oft-used, albeit imperfect, forward indicator for an economy. Consistent with many of the indicators above, DSEX fell from mid-2019. Interestingly, it appears to have bottomed out late last year and was rising as of February 2021.

Overall assessment
Bangladesh’s economy, already slowing before the Covid-19 recession, is yet to show any sign of a durable recovery. Production measures appear to have bottomed out, but perhaps not quite so for household demand. While labour income is recovering, food prices spikes point to problems in the farm supply chain. Policies are supportive of growth. Stock market appears to be optimistic.●
Jyoti Rahman is an applied macroeconomist. His analysis is available at www.jrahman.wordpress.com, and he can be contacted at jyoti.rahman@gmail.com.